Acoustic Emission techniques (AE)
Goal(s)
Main objective
The acoustic emission method provides information about possible catastrophic failures or evaluation of the level of damage in different materials and industries. Concrete structures are subjected to many environmental factors during the life-cycle and for this reason, advanced AE techniques are used to provide monitoring of the internal failures progressing in time. The aim is to link the degree of damage in the structure with the operating conditions of the facility. As one of the non-destructive testing methods with an increasing number of produced equipment modifications has a great potential for bridge monitoring as well as quality control and structural integrity assessment. Deformation of the bridge structure element can be real-time monitored with the use of acoustic emission means as it is known that under loads in the life cycle of the bridge the structural elements from concrete and steel emit elastic waves due to different damage processes. As sensoring technology is a fast developing industry branch and therefore there is a growing number of possibilities of system configuration adjusted for a specific purpose. For long-term monitoring aspects, this is an important factor to the future of the application of AE in structural health monitoring of bridges and other constructions.
Currently, there is a need for improvement of the AE systems in aspects of practicality, and economic issues. Despite that - information collected from the Acoustic Emission Monitoring System is successfully used for overall evaluation of the actual quality of the bridge and can help with planning and prioritization of further repairs and maintenance.
Description
Functioning mode
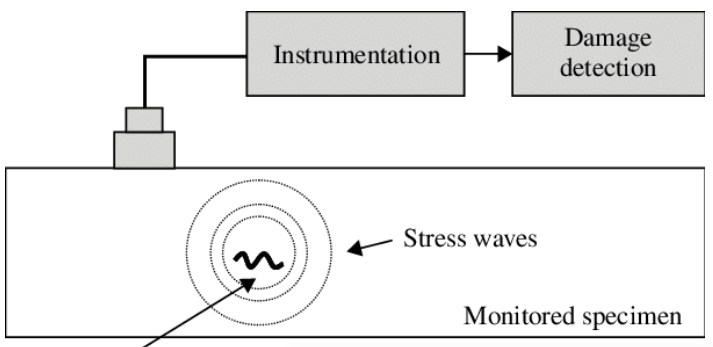
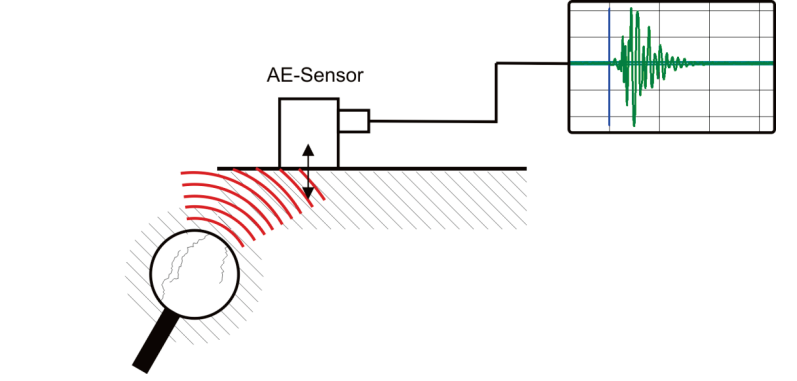
The basis of the method lies in the analysis of the acoustic waves generated by active, destructive processes developed during the operational loads. Elastic waves are generated in a material when it is subjected to stress, which causes deformation or stress field. When the material is subjected to load, the elastic limit can be crossed. This is known as the acoustic emission, which is inaudible but can be detected by sensors attached to the surface of the tested object. Waves are produced in the tested area and then, those waves can be detected and their corresponding intensity is linked with the existence of the defect in the studied structures.
Acoustic emission system consists of one to several acoustic sensors, a preamplifier, the main amplifier, and a computer-based data acquisition device. Other accessories are necessary such as couplant and connecting cables. Piezoelectric transducers are used for the detection of the signals, which transform mechanical waves into electrical signals. When the material is loaded, the elastic limit can be crossed. This is known as the acoustic emission, which is inaudible but can be detected by sensors attached to the surface of the test object.
There are two approaches for the measurement mode:
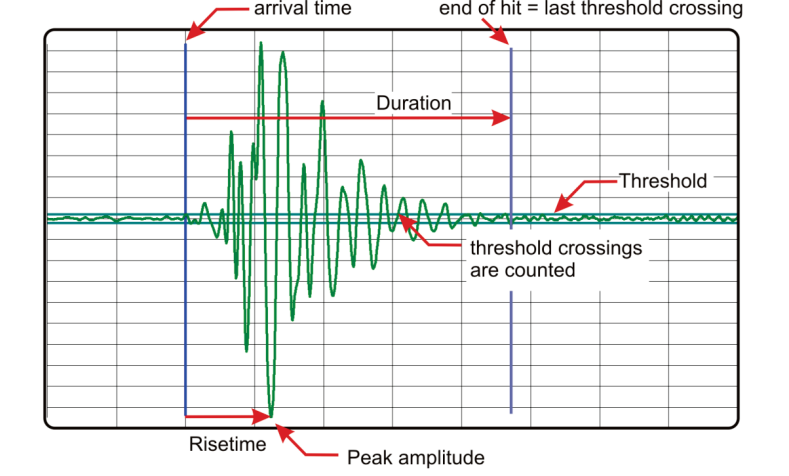
- the parameter-based technique – only extracting parameters from received signals without saving the waveforms. Crucial parameters such as hit, amplitude, count, rise time, duration are recorded to assess AE activities.
- the signal-based technique – characterized by transforming analog signals to electrical signals for quantitative analysis .
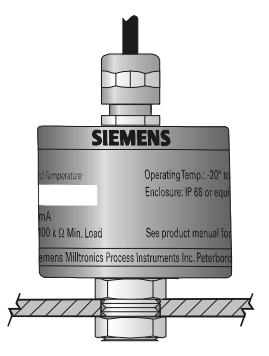
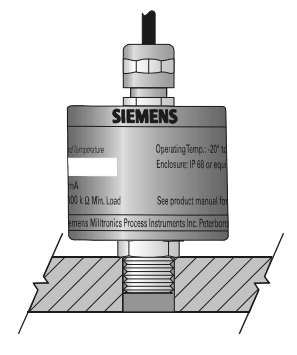
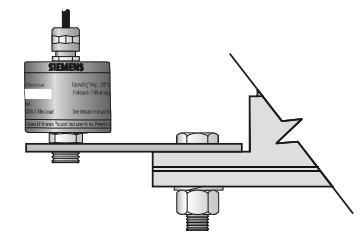
Acoustic sensors can be mounted in four ways, which is shown below:
- through clearance hole:
- through drill and tap:
- with the mounting disc:
- with extension tab.
The transducers can be directed oppositely, parallel, or diagonally.
Systems designed for structural monitoring usually work in the following manner:
- as a transmitting unit – processed data are transmitted to remote locations, where it is possible to analyze information from computer or mobile interface in real-time;
- as a collector unit – processed data are stored in the memory card for further analysis .
The general working principle is shown below in the scheme:
Types
Depending on the application there are different types of equipment used for acoustic emission measurements:* compact, small, usually dual-channel, portable handheld unit optimal for use as a field survey tool with permanent data collection which can be stored on the memory card and then analyzed on the computer; use same functioning mode as monitoring systems, but does not allow continuous monitoring for longer periods; useful for the fast in field and laboratory testing – battery last for few hours; good for areas difficult to reach; composed with two passive sensors, memory card, parametric cable, and battery,
- multi-channel instruments with wireless data transmission for long-term monitoring purposes; composed with at least four acoustic channels, two power supplies, wireless module, memory card and adjusted software for analysis of the collected data, start and termination of the monitoring activities as well as transfer to the base station; allow collecting information about behavior and responses to in-service loads, include alarming system after analysis of the data collected from the baseline and eventual damages .
*
- high sensitivity sensors with integral preamplifier
- frequency differential sensors
- wideband differential sensors
- high sensitivity intrinsically safe wideband differential sensors
- low-frequency sensors
- flat frequency response sensors
- lightweight miniature sensors
- underground sensors,
- epoxy coated underwater sensors .
Process/event to be detected or monitored
Processes that can be monitored by means of acoustic emission sensors are: * detection of dynamic processes in materials,
- detection of leaks,
- detection of flaws,
- tracking of degradation processes in concrete,
- detection of damage mechanisms related to corrosion – cracking, debonding,
- level of intensity of cracking processes,
- integrity testing of metallic structures,
- integrity testing of composite materials,
- integrity testing of concrete structures.
Examples of the detection in concrete elements performed with acoustic emission techniques can be found in .
Physical quantity to be measured (e.g. actions, displacements, deformations, dynamic structural properties, material properties including mechanical, electrical and chemical properties, relative displacements of the two sides of a crack, etc.).
The time of passage of the elastic wave between the transducers should be monitored on the measurement device and recorded. Time of the elastic pulse path from the transmitting to the receiving transducer through the concrete. Wavefront is recorded by measuring device.
Induced damage to the structure during the measurement
The registration of signals of elastic waves is non-destructive for the structures.
General characteristics
Measurement type (static or dynamic, local or global, short-term or continuous, etc.)
Measurement range
- high sensitivity range is obtained when signal level are up to 40 dB,
- low sensitivity range applies when signals are in 28 – 68 dB,
- typical signals frequency range: 1 kHz up to 1MHz, usually divided into three categories – low-frequency range (20 kHz – 100 kHz), standard (100 – 400 kHz), and high (>400 kHz).
- data sets rate: 80 hits/sec per channel,
- up to 310 m line of site .
Measurement accuracy
- measurement path can be recorded with +/- 1% accuracy. The sensitivity of acoustic emission is affected by temperature. In most applications, this is not a concern when considering the much greater changes in signal level due to changes in flow.
- if the temperature of the standard Sensor increased from 20 °C to 50 °C, its sensitivity would decrease by 15%. If the Sensor were to be used to monitor flow changes over such a temperature range, you should set an associated alarm set point at least 30% away from the normal operating level measured at 20 °C.
Background (evolution through the years)
B.H Schofield firstly named sound-emitting phenomenon as ‘Acoustic Emission’ in his publication. Important works on the method has been made in 1970 by monitoring of the portable military bridge. First analysis of the amplitude distribution has been performed back then. In 1980 first investigations had been carried out to see if it is possible to use acoustic emission techniques for continuous and long-term monitoring. The next advance was made by the performance of the monitoring crack activity in steel bridges. Physical Acoustic Corporation performed many experiments to study different types of sensors and use of additional guard sensors to eliminate unwanted signals from the consideration .
Performance
General points of attention and requirements
Design criteria and requirements for the design of the survey
Procedures for defining layout of the survey
Sensibility of measurements to environmental conditions
Preparation
Procedures for calibration, initialisation, and post-installation verification
Calibration involves probing with an oscilloscope to set gain and threshold levels. The sensors are installed at the points of the sample using high-vacuum grease with adhesive tape to enhance the coupling performance at the interface between the concrete and the sensor.
Procedures for estimating the component of measurement uncertainty resulting from calibration of the data acquisition system (calibration uncertainty)
Requirements for data acquisition depending on measured physical quantity (e.g. based on the variation rate)
Performance
Requirements and recommendations for maintenance during operation (in case of continuous maintenance)
Criteria for the successive surveying campaigns for updating the sensors. The campaigns include: (i) Georeferenced frame, i.e. the global location on the bridge; (ii) Alignment of sensor data, relative alignment of the data collected in a surveying; (iii) Multi-temporal registration to previous campaigns; and (iv) Diagnostics.
Reporting
Report should include: * identification of concrete sample and construction,
- date,
- localization,
- age of the concrete,
- temperature,
- localization of the transducers,
- identification of the apparatus used,
- velocity of the elastic wave on each measurement path.
Lifespan of the technology and required maintenance (if applied for continuous monitoring)
Specially designed wireless systems give the possibility for continuous monitoring longer than one year.
Interpretation and validation of results
Expected output (Format, e.g. numbers in a .txt file)
Graph with a discrete electrical signal at the output of a sensor, amplitude on the sensors [dB] vs time [s]. List of measured times necessary to overcome the path between transducers for each length. Other parameters:* number of signals,
- signal amplitude is given in mV or dB,
- signal energy,
- burst signal energy: the energy of the electrical signal caused by a detected burst,
- burst signal peak amplitude: the highest voltage excursion of the detected burst signal,
- rise time: the time difference of the peak occurrence to the start of the hit,
- duration: the time difference between the end of hit and start of the hit,
- counts: the number of positive threshold crossings in the time period between start of hit and end of.
An example of the output on one of the sensor responses is shown below:
Interpretation (e.g. each number of the file symbolizes the acceleration of a degree of freedom in the bridge)
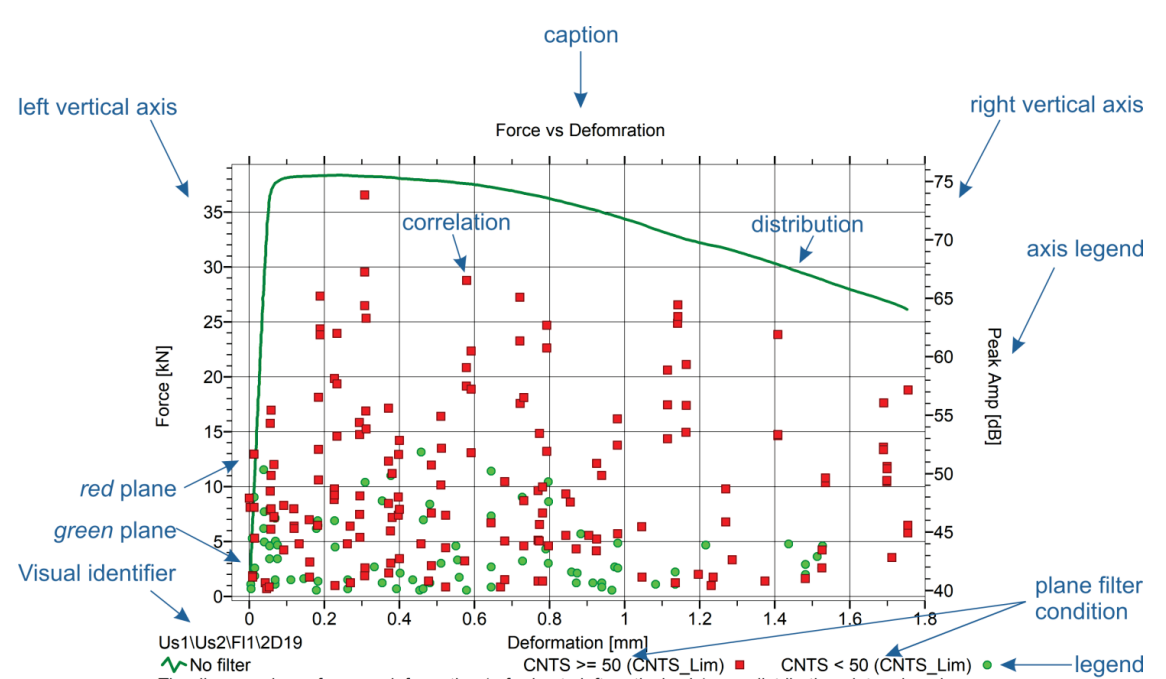
TR diagrams show waveforms (transient data) in the time and/or frequency domain. AE diagrams are used to plot any of the available AE attributes, time, or parametric data against each other. AE diagrams can be 2D or 3D.
Comparative analysis of the emission signals recorded during the test of the object with the created model database of destructive signals allows for the identification and location of active destructive processes. Measured time is used to calculate the velocity of the ultrasonic wave, where the length of the measuring path in meters is divided by the time needed to transmit to wave on a selected path in seconds. An intensity analysis technique has to be performed to accumulate obtained data and use it for characterization of the damages. Comparison of the intensity of the signals on each sensor gives information about potential failure risk in the structure.
Validation
Specific methods used for validation of results depending on the technique
Quantification of the error
Quantitative or qualitative evaluation
Detection accuracy
Specific correlations between the different factors influencing the accuracy of results are described in the norms: EN13477-1, Non-destructive testing – Acoustic emission testing – Equipment characterization – Part 1: Equipment description and that can be verified according to EN 13477-2, Non-destructive testing – Acoustic emission testing – Equipment characterization – Part 2: Verification of operating characteristics.
Cracks can be detected with 0,01 mm accuracy.
Advantages
Acoustic emission can be particularly effective for monitoring damages in foundations, which are not visible using a typical monitoring system. It is capable of detecting the onset of failure and locating the source of possible failure. Since acoustical signals come from defects throughout the structures a few transducers are enough to detect and locate defects over large areas. Enables localization of the particularly dangerous areas and quantification of the issue.
Taking into consideration systems needed for bridge monitoring: * both local and global measurement possible
- no interference with the traffic on the bridge
- remote navigation and analysis of the data
- customized alarm system upon reaching user-defined damage thresholds
- internal storage of the data
- power saving options
- compatibility with different power sources and batteries
- simple connection to the base station.
Disadvantages
Disadvantages of the method include:* requirement of two-sided access to a given measurement site,
- sensitivity to the differences in the moisture content of the concrete surface,
- sensitivity to the presence of reinforcing bars,
- difficulty with measurements, when complex geometry is given,
- difficulty with measurements when large number of defects is present,
- more suitable for new bridges and construction as a supplement for standard inspection.
Possibility of automatizing the measurements
Rapid progress of microchips causes immediate appearance new, more compact, convenient and informational - capacious AE instruments.
Barriers
The main barrier is the technological need for decreasing the power level consumption to extend the lifetime of the battery used.
Existing standards
- EN 13554:2011 Non-destructive testing - Acoustic emission testing - General principles,
- EN 473 The European Standard for Qualification and Certification of NDT Personnel,
- EN 1330-9, Non-destructive testing —Terminology — Part 9: Terms used in acoustic emission testing,
- ASTM E3100 – 17 - Standard Guide for Acoustic Emission Examination of Concrete Structures,
- ISO 16836:2019, Non-destructive testing — Acoustic emission testing — Measurement method for acoustic emission signals in concrete,
- ASTM E650, Standard guide for mounting piezoelectric acoustic emission sensors,
- ASTM E1106, Standard method for primary calibration of acoustic emission sensors.
Applicability
Relevant knowledge fields
1.12.1 Industry:
- machine condition monitoring,
- cavitation monitoring,
- leak detection,
- production quality control.
1.12.2 Chemical industry:
- reactor vessels testing,
- offshore testing,
- drill pipe testing,
- pipelines testing,
- transformers testing,
- valves testing,
- hydro treaters.
1.12.3 Aerospace technology:
- aging aircraft’s evaluation,
- rocket motor testing,
- fatigue cracks detection.
1.12.4 Energy industry:
- nuclear reactors testing,
- steam generators testing,
- ceramics insulators,
- transformers,
- aerial devices.
Performance Indicators
- delamination,
- cracks,
- rupture,
- displacement,
- reinforcement bar failure/bending,
- loss of section,
- debonding,
- deformation,
- holes,
- wire breaks.
Type of structure
- bridges,
- tunnels,
- walls,
- viaducts.
Spatial scales addressed (whole structure vs specific asset elements)
- knots and stringers,
- hanger connections,
- link pin connection,
- copes and stringers,
- stiffener to weld connection.
Materials
- concrete,
- steel,
- composites,
- ceramics,
- polymers.
Available knowledge
Reference projects
WI-HEALTH: Wireless network for total SHM of bridges (EU FP7 2011-2013).
Other
Examples of use of acoustic emission uses: * use of the acoustic emission and base of reference signals for viaduct located in Kielce, Poland.
- use of acoustic emission for assessment of the technical condition of the bolted bridge in Sandomierz, Poland.
- self-powered Sensor Network for Bridge Health Prognosis, sponsored by the National Institute of Standards and Technology (NIST) through the Technology Innovation Project Grant (TIP).
Wireless Acoustic Emission Systems – overview in a publication
Manufacturers websites:
Acoustic Emission Sensing System
Physical Acoustic – overview of the products and system elements
MARPOSS Acoustic Emission Sensors
Vallen Systeme – Acoustic Emission Sensors and preamplifiers.
