Fibre optic sensors
Goal(s)
Main objective
One of the relatively new technologies that have found many applications in different industries, including civil engineering, is the sensoring with use of fibre optics. It is quite a new tool for the assessment of the structural integrity or performance of civil structures such as bridges or tunnels in comparison with the techniques present in European Union standards. However with a great perspective in long-term monitoring and remote control of the condition of facilities. FOS technology allows to measure the bridge/tunnel performance under traffic loads and store the information globally with expanding modern data storage solutions. At the moment it is still not widely used as a diagnostic tool across the European Union for maintenance of the existing civil structures
It is worth mentioning that FOS can be also useful in situations, where there is a need for control of the surrounding civil engineering structures in the vicinity of the construction site. In such a case it is possible to control the impact of the construction works/vibrations on the existing civil structures and therefore prevent serious accidents.
Description
Functioning mode
The light source (an LED) transmits the light beam down the fiber optic cable by repeatedly reflecting the light off the boundary between the fiber core and its sheath. When it reaches the end of the fiber the light is dispersed at the end. When the light is dispersed it spreads out and forms a beam much like that of other sensors.
The first element that must be considered in the system for FOS monitoring is the optical fiber used as sensor adjusted to be sensitive to their state and environment. Standard optic fibre is made of silica and can transmit light with very high efficiency over long distances. Considered technology used with fiber optics there are following functioning modes: * Fabry-Perot Interferometers – point sensors, a single measurement point at the end of the fiber optic connection cable, similarly to most electrical sensors;
- Low-Coherence Interferometers – long base sensors, sensors integrate the measurement over a long measurement base, known as long-gage sensors;
- Fiber Bragg Grating sensors – quasi distributed sensors, microstructure of Bragg Grating causes periodic changes in the refractive index of the laser beam. As light travels along the fiber, the Bragg grating reflects a very narrow range of wavelengths. All other wavelengths pass through the mesh. The center of the band of reflected wavelengths is known as the Bragg wavelength. Due to the deformation of the structure, the wavelength is modified due to the physical stretching or compression of the optical fiber. This change causes a wavelength shift which is then detected and recorded by the interrogator or optical data acquisition system.
- Distributed Raman/Brillouin Scattering sensors – sensing at any point along a single fiber line, typically every meter over many kilometers of length .
The physical quantity measured by optic fibre is changed into modulation of the light wave. In general, the studied physical quantities can influence the light wave in a different way – externally in the measurement chamber or directly, internally through the fibre optic structure. Depending on the type of modulation of the light wave parameter there are different categories of the sensors such as:* sensors with wave intensity modulation,
- sensors with wavelength modulation – with Bragg grating to measure temperature changes, deformation, acceleration, inclination,
- sensors with light wave phase modulation – interferometers and fiber optic gyroscopes
- sensors with wave polarization modulation
Details on the mechanisms for the selected functioning mode can be found in .
Types
The fiber optics are small and can be mounted in places where other sensors could not fit. Fiber optic sensor heads can be used in areas that standard sensors are unable to operate, for instance hazardous areas. This is because no electric current flows through them. This also means they are totally unaffected by electrical noise (provided the amplifier is suitably positioned). By using glass fibers instead of plastic they can be used in areas of up to 350°C.
There are different classifications of the sensoring technology with fibre optic sensors. It is worth to start with types of heads of the sensors available on the market:* standard cylindrical shape
- square shape
- miniature shape
- long distance shape
Taking into account number of fibers used can be divided into: * Single-mode optical fibers, which are used especially in telecommunication, in this case, the diameter is typically from 5 to 10 µm, depending on the light wavelength that is designed for
- Multi-mode optical fibers, which are used mostly in the medical field, and the diameter core up above 100 µm
Due to mounting location of the optic fibres:* Intrinsic sensors
- Extrinsic sensors
In civil engineering structures monitoring there are used single-mode extrinsic sensors for measurements of relative displacement, deformation, pressure, stress load.
Process/event to be detected or monitored
Due to the deformation of the structure, the wavelength is modified because of physical stretching or compression of the optical fiber. This change causes a wavelength shift which is then detected and recorded by the interrogator or optical data acquisition system.
Inspection of stresses and deformation inside a reinforced concrete structure. Strain and crack analysis – distribution of the measured quantity along a given line.
Physical quantity to be measured
- Depending on the application and used type of optical fibre sensor it is possible to measure: Strain
- Deformation
- Temperature
- Vibration
- Pressure
- Acceleration
- Inclination
Induced damage to the structure during the measurement
No damage induced to the structure. For bridge monitoring sensors are mounted on the surfaces without interference in the structure integrity.
General characteristics
Measurement type (static or dynamic, local or global, short-term or continuous, etc.)
* for Fabry Perot Interferometers (FISO) – local measurements of temperature, strain or displacement in long-term adjustment,
- for Low-Coherence Interferometers (SOFO) – global and continuous measurements of the concrete and geotechnical structures, also working as references,
- for Fiber Bragg Grating Sensors (FBG) – geometrically continuous measurements in long-term adjustment,
- for Distributed Raman Scattering Sensors – local average temperature for fiber lengths up to ten of kilometres – detection of hold/cold points, leaks etc.
- for Distributed Brillouin Scattering Sensors – possibility to measure distributed strain in contrary to Raman Scattering sensors and therefore detection of cracks, movements, deformations, settlements
Measurement range
Measurement path of deformation for each sensor can be varying from 1 to 2 m path.
* displacement sensor for monitoring applications (HBM), suitable for bridge piles, sustaining walls and whole buildings) has a following specification: measurement range +/- 40 mm, resolution of 20 µm,
- static and dynamic strain sensor for structural health monitoring applications (HBM), with range of strain measured between +/- 2500, +/- 5000 +/- 20000 µm/m, resistant to temperature up to 100°C,
- temperature sensor (HBM), (e.g. weldable for metallic structures, for laboratory use etc.) with measurement range between -20°C to 80°C, with aramid cables for difficult environments,
- fiber optic piezometer for pressure measurement (Roctest) with range from 200 to 7000 kPa and resolution up to 0,0025%.
- fibre optic strain sensors (NERVE-SENSOR) – for strain and crack measurements – strain measurement range - 4% and resolution up to 1,0 µe.
Measurement accuracy
* For displacement sensors, depending on the producer measurement accuracy is on the level of 0,1% and resolution of 0,002 mm (Roctest)
- For temperature sensors as well accuracy vary on the producer, typically on the level of 0,1 °C (Roctest)
- For piezometric sensors Roctest) accuracy is usually on the level 0,1% with resolution 0,025%.
Background (evolution through the years)
Fibre Optic Sensoring technology would not exist without the finding and description of the phenomenon of propagation of the light in water in 1870 made by John Tyndall . In ten years from that discovery there was a patent released by William Wheeling, where fibre optics supposed to be used as a source of light inside the buildings, however did not replace the Edison bulb for economic reasons. High development of the technology has started after 1950s, since a lot of new scientific papers has been released at that time, describing the phenomena in details. For the first time the concept called optic fibre cable has been used by Brian O’Brien and Narinder Kapany, however their research was focused on the application of optic fibres in endoscopy for human body investigation . In the beginning the technology were designed mostly for very simple types of sensors such as card readers for computers and then rapidly developed .
Further development of the fiber optic sensors focused on different types of measurements and by now the technology is quite universal for various detections – strains, structural deformations, vibration, pressure, temperature, frequencies .
The first optical fibers had attenuation at the level up to 100 dB/km. Recent optical fibers have a high purity of glass material and their attenuation is very low at the level under 0.2 dB/km.
In past decades various devices, including fiber optic gyroscopes; sensors of temperature, pressure and vibration have been under the development of FOS technology. .
Performance
General points of attention and requirements
Design criteria and requirements for the design of the survey
Used optic fibres should be dedicated for the measurements on long measuring distances in difficult operating conditions. In places where sensors will be mounted it is necessary to remove the paint covers and to clean the surface. After placement of sensors – epoxy paint is applied for safety.
Procedures for defining layout of the survey
There are no uniform guidelines specifying the layout of the survey for fibre optic sensors methodology, however there are few issues that have to be considered:
Design of the survey should be preceded by following considerations:* determination of the measured quantities,
- localization of the measurement points, arrangement of the sensors,
- frequency of the measurement (depending on the technology),
- limit levels for the measured physical quantities, the exceeding of which requires a decision making process,
- choice of the technique – types of sensors, installation method,
- desired accuracy,
- data analysis methods to be included and theoretical models if necessary.
For different applications with use of fibre optic sensors special attention is required: in outdoor use, potential chemical contamination and environmental conditions that will be having major influence on the system performance during service life. In applications of fiber optic sensors such as nuclear energy control systems, railroad systems, aviation systems there should be taken into account safety and/or government regulations additionally. The risk should be assessed before implementation of the system in order to avoid any serious injuries and accidents.
Regarding the sensor itself and arrangement of the arrays in real cases, clearly varying on the producer specification, there are few key points that should be considered when mounting the monitoring system, such as:* amplifier cable should be separated from power lines and high voltage lines – otherwise if they are placed in the same conduit, detection error will occur from the noise interference or the sensors will be damaged,
- sensitivity setting may fluctuate and units can heat up if incorrectly wired,
- direct lightening should be avoided,
- sensors should not be used in atmosphere where inflammable gas, powder, liquid is present since they are not explosion-proof,
- when several units are connected the ambient temperature should be confirmed; depending on the number of units the range is different for instance in case of 3-10 units it is as follows: -10°C – +50°C, while for more than 10 units - -10°C – +45°C ,
Sensibility of measurements to environmental conditions
Fibre Optic Sensors are insensitive to humidity, corrosion, vibration and electromagnetic fields. Variation on the data graph during the measurement can result from thermal elongation of the bridge, change of the temperature and drying shrinkage. However those influences are controlled by the monitoring systems .
Preparation
Procedures for calibration, initialisation, and post-installation verification
*
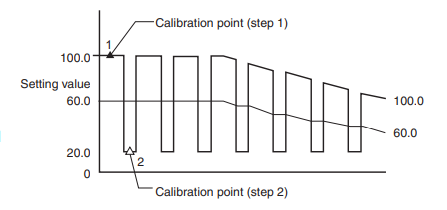
- 2 – point calibration – setting value established by pressing the set button on the amplifier when the object to detect is present and once when I absent. The setting value is set to the middle of the values between both of this measurements,
- Maximum sensitivity calibration - method suitable when the received light intensity is expected to be reduced by dirt, the setting value is set slightly higher than the received light intensity when the setting was executed,
- Full Auto Calibration – the sensitivity is set automatically using a moving object. The setting value is determined as the middle value between the maximum and minimum received light intensity received while holding down the set button,
- Positioning Calibration – used when precise position detection is needed and in this case center of the projecting beams must align with the center of the object.
Procedures for estimating the component of measurement uncertainty resulting from calibration of the data acquisition system (calibration uncertainty)
Requirements for data acquisition depending on measured physical quantity (e.g. based on the variation rate)
Performance
Requirements and recommendations for maintenance during operation (in case of continuous maintenance)
* stray light should be avoided, which makes the sensor works incorrectly and the sensitivity will be influenced, basically this should be considered as well when deciding on the types of sensors selected in the first place,
- any dirt, dust should be repeatedly removed from the surface of the sensor since the sensitivity will be as well changed due to its presence, however for some types of the sensors there are mechanisms which automatically correct the sensitivity and maintain at fixed ratio when sensor detecting surface has become dirty,
- workpiece colour variation should be avoided, since this changes influence the ability to obtain the expected light intensity – sensitivity should be adjusted that the output is on the presence of the colour with the lowest reflectance,
- regular calibration should be performed.
Reporting
Reporting and visualization of the data is done automatically in the software given by the producer. Depending on the manufacturers the layout can be different and adjusted for specific purpose. Always there are present information such as date and hour, localization of the measurement points on the bridge for example, recorded values and statistical analysis. However the final output depends on the settings of the end user.
Lifespan of the technology (if applied for continuous monitoring)
The lifespan of the systems with sensors is characterized as the minimum length of time over which the sensor will operate, either continuously or over a number of cycles without changing performance characteristics beyond specified tolerances. The continuous measurement system with fibre optic sensors has a high durability - over 30 years. For telecommunication applications for instance the service life of the fibre optic is greater than 20 years without any failure. It is important to know that environment can greatly influence the expected service life of the optic fibers, especially when the coating is damaged and the fibers are subjected to moisture. Inspection of the coating has to be carried out in different intervals especially in the places where there are various and changing climatic conditions to ensure their performance for long period of time. Also stress load applied to the fibers during their service life is highly influencing the lifespan of the technology itself.
Interpretation and validation of results
Expected output (Format, e.g. numbers in a .txt file)
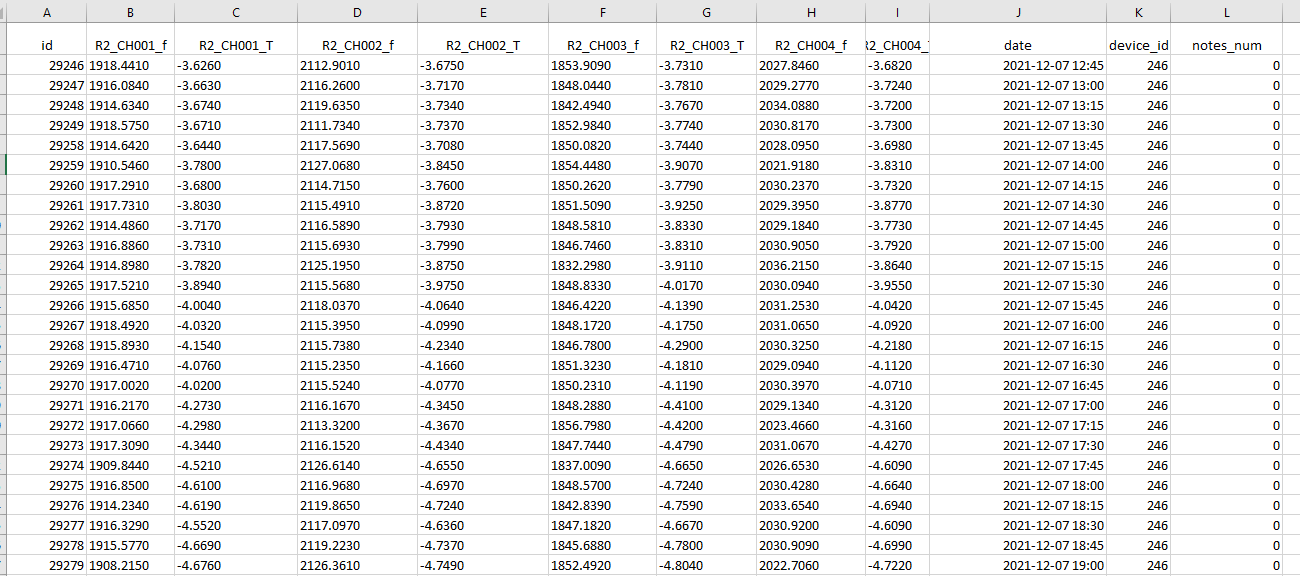
Raw data registered in the software depending on the measured physical quantities defined by the operator/end user (for example temperatures/frequencies measured in different channels), which can be exported to csv/Excel file:
Interpretation (e.g. each number of the file symbolizes the acceleration of a degree of freedom in the bridge)
As a result of deformation, the length of the optical fiber changes, and thus the distance between local defects of the structure changes. The appearance of the dissipation profile before and after mechanical stress are compared with each other. On this basis, the distribution of mechanical deformations is determined.
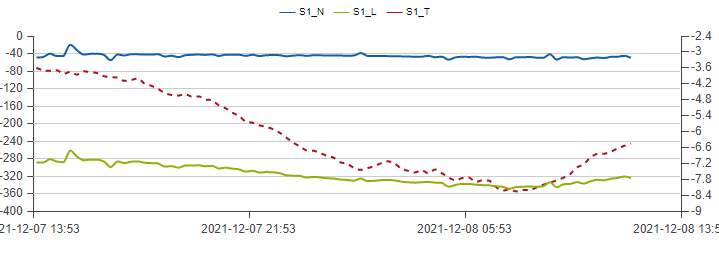
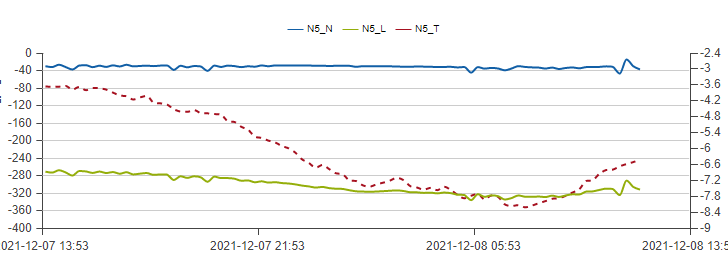
Raw data are cleaned and processed automatically in the software and there are presented statistic/graphs/ abnormal signal information about the measured quantities, depending on the settings of the user. For example – when deformation and temperature on the bridge is registered in real-time, after automatic data analysis, there can be presented graphical dependence of the deformation in µε and temperature in °C in time for different measurement locations on the bridge, as below:
Validation
Specific methods used for validation of results depending on the technique
Quantification of the error
Quantitative or qualitative evaluation
Detection accuracy
Examples of the accuracy of the fibre optic sensors available on the market:
- Sensors for detection of the non-conductive liquids – fluid level can be detected accurately up to 1 mm .,
- Sensors for temperature measurements – detection between -50°C to 100°C and resolution 0,02 to 0,05°C of range,
- Sensors for pressure measurements – detection in range 10, 20, 100 bar, maximum pressure – 150% of range and resolution 0,001 to 0,002% of range. Sensitivity: 450 up to 3000 pm/ZP (SmartFibers),
- Sensors for strain measurements – µstrain range - ±9, sensitivity pm/µstrain -1,2, resolution 0,4 (EC Test System),
- Sensors for vibration measurements – bandwith 0- 1000 Hz or 0-350 Hz (SmartFibres),
- Sensors for deformations measurements –-1,5% for compressing to +1,5% for stretching of measurement range DiTeSt SMARTube).
- Sensors for displacement measurements -
Advantages
- Possibility of continuous measurement along the length of the monofilament, and therefore also along the length of the structural element to which the fiber has been attached;
- Allows replacement of plenty of traditional sensors with one single optical fiber;
- Longer lifetime compared to conventional resistance strain sensors;
- Long-term signal stability under unfavorable conditions;
- Possibility of placing several sensors on the same fiber;
- Resistance to interference;
- Cost of the measurement system is relatively low, easy to install, highly sensitive, compact in size.
Disadvantages
Optical fibres are fragile and prone to damage during use. Care should be taken while use.
Possibility of automating the measurements
Remote server includes the software for data analysis, results presentation and automatic alerting. Manufacturers offer sensors compatible with different open networks for advanced traceability, and maintenance. Different networks are available EtherNet/IPtm , DeviceNet, PROFIBUS, EtherCAT, CC-Link. Advanced visualisation and analysis can be performed with real-time data transferred over IO-link. .
Actual developments on FOS systems consist of use of new materials to produce fibre optic sensors, such as hybrid sol-gel materials and development to simultaneously monitor moisture, pH, chloride ions, alkali-silica reactions in concrete .
Barriers
Technical problems such as adhesion between the measuring fiber and the surrounding medium. Problems with installation of thin optical fibers into the analysed medium.
Existing standards
- EN IEC 61757-1-1:2020-12 - FIBRE OPTIC SENSORS - PART 1-1: STRAIN MEASUREMENT - STRAIN SENSORS BASED ON FIBRE BRAGG GRATINGS
Applicability
Relevant knowledge fields
Civil engineering:
- smart structures, where sensors are used to detect vibration, temperature, and stress, detection of anomalies of electromagnetic fields in power distribution systems, leak detection, temperature and stress monitors, gripping mechanisms, and other applications in industrial manipulators and mobile robots, multi-point measurement systems of one quantity and measurement systems of several quantities at different measurement points.
Energetics:
- wind turbines, pipelines, nuclear reactors, generators inspection
Marine Transportation:
- cabins, decks inspection
Aviation:
- composite structures
- wind tunnels
Internal Security:
- security gate monitoring.
Other applications can be found in - .
Performance Indicators
- cracks
- rupture
- holes
- wire break
- loss of section
- displacement
- deformation
- obstruction/impeding
- stirrup rupture
- deteriorated mortar joints
- tensioning force deficiency
- delamination
- debonding
Type of structure
- bridges,
- tunnels.
Spatial scales addressed (whole structure vs specific asset elements)
Materials
- concrete,
- reinforced concrete,
- composites,
- steel,
- wood.
Available knowledge
Reference projects
SUSTAINABLE BRIDGES – Assessment for future traffic demands and longer lives.
Com-Bridge” (program DEMONSTRATOR+)
ISTIMES – Integrated System Transport Infrastructure surveillance and Monitoring by Electromagnetic Sensing, WP4: Sensing Technology.
Other
Examples of the application of monitoring systems with the use of fiber optic sensors: * Design of diaphragm walls made of fiberglass concrete, Poland ,
- Laboratorial intelligent bridge system made of polymer composites (OptiDeck project), Poland ,
- Monitoring of a bridge over the Vistula in Puławy, Poland
- Monitoring of a composite bridge in Nowa Wieś near Rzeszów, Poland ,
- Monitoring of the two composite bridges located along public roads in Podkarpacie constructed within project “Com-Bridge” (program DEMONSTRATOR+),
- Monitoring of a composite footbridge in Nowy Sącz, Poland ,
- Monitoring of the Rędziński bridge in Wrocław, Poland ,
- Monitoring of a pedestrian bridge over the river Malý Dunaj in Bratislava, Slovakia,
- Steel bridges monitoring: “Przemyska Gate” in Przemyśl and Tadeusz Mazowiecki bridge in Rzeszów, Poland,
- Measurements on the concrete road bridges in Naples and Potenza, in Italy,
- Monitoring in the Venoge bridge with sensors covered with polyimide coated fibers,
Manufacturers websites:
LiComm – amplifiers, analog optical transceivers


