Qualitative chemical methods
Goal(s)
Main objective
Chemical methods based on pH determination are widely used for inspection of the carbonation front depth, and determination of whether the standard pH of concrete has been changed under environmental conditions. The carbonation of concrete consists of many physicochemical changes due to the constant influence of the carbon dioxide from the air as well as in the indoor atmosphere of building structures. The carbonation process has a complicated effect on concrete properties and leads to a decrease of the alkalinity resulting in a loss of protective properties against the reinforcement. From the point of view of diagnostic tests for bridge structures it is crucial to use pH indicators to analyse analyze of the carbonation process and assessment of the natural ability of concrete to protect the reinforcement against corrosion – eventually to prevent the risk of degradation of the entire structure.
Description
Functioning mode
- pH indicators – methods used for pH determination work on the principle of visual observation of the changes of colors on the sample after subjecting to a specific indicator. For concrete structure applications indicators are used in a form of spray, such as phenolphthalein, thymolphthalein, or universal indicator. Used compounds are widely known in various industries, so this methods are well established .
- Uranyl-Acetate Treatment – method base on the use of uranyl acetate solution and UV light source for inspection of concrete structures to determine presence of gel in the composition, associated with observation of the change of color under UV light in areas subjected to Alkali-Aggregate reaction; uranyl acetate solution is applied from a plastic squeeze bottle or spray.
- Half-cell potential – method base on the measurement of potential detected at the electrode of a half cell in an electrochemical cell. reinforcing concrete, an electrode forms one half of the cell and the reinforcing steels in the concrete form the other half cell Registered data are used for evaluation of corrosion probability and potential vulnerability to corrosion;
- Electrical resistivity tomography – calculates the distribution of electrical resistivity from a large number of resistance measurements made from electrodes on a concrete sample; the procedure is repeated using different current patterns, and the three-dimensional conductivity distribution is reconstructed from data set corresponding to multiple current applications. Available modes of, measurements are apparent resistivity mode, resistance mode, voltage mode, and battery voltage mode.
- Infrared Spectroscopy – measures the change in the dipole moment of molecules due to irradiation with light at frequencies that trigger transitions between vibrational energy levels of molecules. The two most common modes are:
- Transmission mode,
- Attenuated Total Reflexion mode.
Details on electrical resistivity tomography and infrared spectroscopy functioning modes can be found in .
Types
- pH indicators:
- Phenolphthalein test (Deep Purple indicator) – spraying indicator, which is an alcohol solution of phenolphthalein, changing color at pH values higher than 8,
- Thymolphthalein test – spraying indicator with a solution of thymolphthalein, changing the color to navy blue when pH is higher than 9 ,
- Rainbow test for pH determination; spraying indicator which is used for pH changes in the range of 5 to 13.
- Uranyl-Acetate Treatment – powdered indicator is used as a source of ultraviolet of short wavelength. Uranyl acetate solution is applied from plastic bottle or sprayer.
- Half-cell potentials method – for reinforced concrete samples, half-cell electrodes are made
- Electrical resistivity tomography - two types of electrodes are usually used in this method:
- wet electrodes – the wet sponge is submerged in the solution of copper - sulphate and placed in the copper cylinder covered by a plastic casing; sponge is attached to the concrete surface and current is applied to the copper cylinders; springs are used to push the electrodes to the concrete surface,
- gel electrodes – steel electrodes with non-polarizing electrode gel between steel and concrete; there is used for example KIT4 Electrical impedance Tomography Measurement System designed by the University of Eastern Finland; two types of electrodes can be used – wet and gel electrodes which are designed for measurement with concrete samples; systems can be designed for 2D imaging or 3D imaging with 60 or 120 channels.
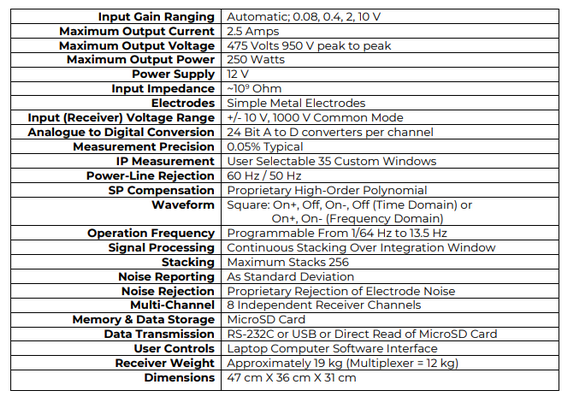
Example parameters of the Electrical Resistivity Tomograph are shown below:
- Infrared Spectroscopy – the IR spectrophotometer consist of the radiation source, the chamber for sample, photometer, monochromator, and detector. The optical system of the IR spectrophotometer is in the form of a series of mirrors guiding the proper course of the radiation beam. Prisms or diffraction gratings are used as the monochromator. As a prism material must be permeable to IR radiation - the most common are sodium chloride NaCl or potassium bromide KBr crystals .
Process/event to be detected or monitored
- pH indicators – pH evaluation based on the visual inspection of the cross-section of sample and colors revealed by indicator used; localization of the corrosion center and depth of carbonation process; estimation of the service life if penetration of the carbonation front is high.
- Uranyl-Acetate Treatment – change of the color on the sample due to presence of gel associated with alkali-aggregate reaction or no change, which excludes the influence of alkali-aggregate reaction in potential degradation at the time of inspection; early stage of cracking.
- Half-cell potentials method – determination of the probability of corrosion within the rebar based on half-cell potential changes within the sample.
- Electrical resistivity tomography – crack detection, localization of rebars .
- Infrared Spectroscopy – monitoring of carbonates formation.
Physical quantity to be measured (e.g. actions, displacements, deformations, dynamic structural properties, material properties including mechanical, electrical and chemical properties, relative displacements of the two sides of a crack, etc.).
- pH indicators - no quantity is measured directly during the test, only visual assessment.
- Uranyl-Acetate Treatment - no quantity is measured directly during the test, only visual assessment.
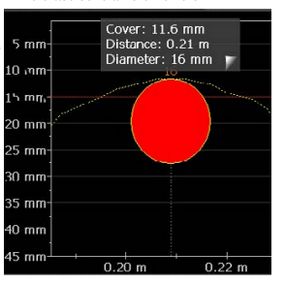
- Half-cell potential method – the potential difference between both electrodes, rate of dissolution of the anode, spacing between rebars, cover diameter
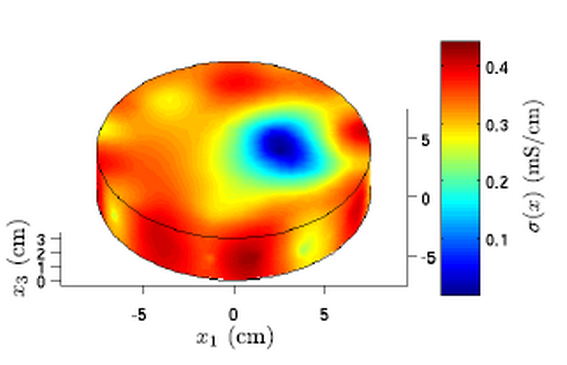
- Electrical resistivity tomography - conductivity [µS/cm] distribution, voltages are measured between several electrode pairs.
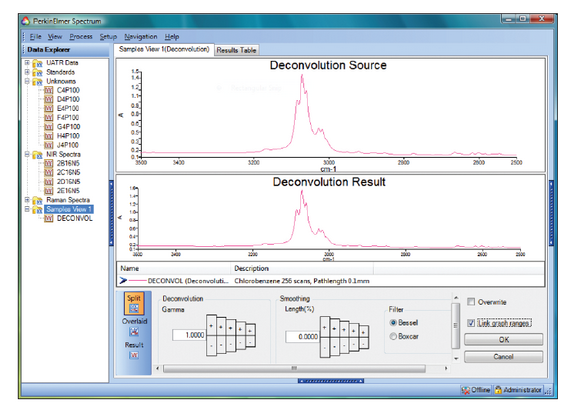
- Infrared Spectroscopy – absorption level [%] vs wavenumber [cm-1].
Induced damage to the structure during the measurement
Samples for pH determination should be taken as newly cut out form or freshly broken piece of concrete from different depths of the structure. There is also a possibility of examination and application of indicators directly on the fresh fracture or forgings of the structure, without additional damage. In other methods there is a need to collect the sample as a drilled part of the structure so the damage is induced in the preparation stage.
General characteristics
Measurement type (static or dynamic, local or global, short-term or continuous, etc.)
- pH indicators - local investigation within at least five different points of the inspected area, short-term.
- Uranyl-Acetate Treatment - local investigation within at least five different points of the inspected area, short-term.
- Half-cell potentials method – local investigation which can be performed short-term, changes of the potential are dynamic, however there is only registered a value at specific time and location.
- Electrical resistivity tomography – local and short-term measurement, geometrically continuous.
- Infrared Spectroscopy – local and short-term measurement.
Measurement range
- pH indicators - with deep purple test pH can be measured in a range of 8.5 to 9.5. For thymolphthalein test the pH upper limit is 10. Rainbow test can be used in a range of 5 to 13.
- Uranyl-Acetate Treatment – not applicable;
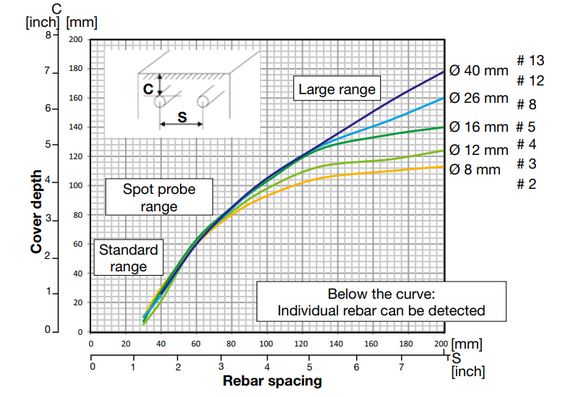
- Half-cell potentials method – range depends on the conditions of the sample, for example for humid and chloride free concrete sample potential values can be measured within range -200 to +100 mV, while for dry concrete within 0 to + 200 mV; also depends on the size of the rebar:
- Electrical resistivity tomography - depending on the instruments used, resistance can be measured within range: 400 kΩ – 0,1 mΩ and voltage within 0 - 500V;
- Infrared Spectroscopy – spectra is registered within the wavelength range of 2,500 to 16,000 nm.
Measurement accuracy
- pH indicators - depth of the carbonated surface should can be measured with an accuracy of 1 mm.
- Uranyl-Acetate Treatment – used only as an estimation technique, accuracy is not recorded.
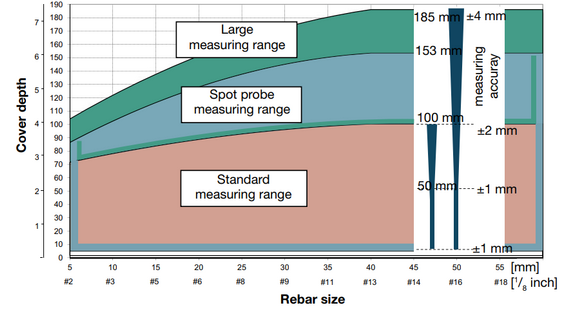
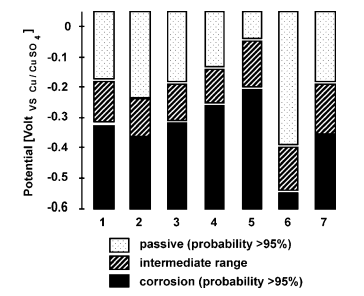
- Half-cell potentials method – please see measurement range section and the resolution is given on the diagram below:
- Electrical resistivity tomography – depends on the equipment used.
- Infrared Spectroscopy - depends on the equipment used.
Background (evolution through the years)
Rainbow test has been created by Germann Instruments in Denmark. In 1991 the pH value has been correlated with the depth of carbonation process. Electrical resistivity tomography was developed in the same time as electrical impedance tomography in 1978. Theoretical and practical aspects of both ethod has been developed since 1980 .
Performance
General points of attention and requirements
Design criteria and requirements for the design of the survey
- pH indicators – surface of concrete should be cleaned and smoothed before test.
- Uranyl-Acetate Treatment - grinding wheel or electric drill is used to grind off surface layer of concrete and rinsed with tap water; protective eye wear and rubber gloves have to be used. Concrete surface should be investigated in a darkened room or, when in the field, through viewing openings in a box that prevents light from reflecting on the concrete surface.
Procedures for defining layout of the survey
- Half-cell potentials method - the survey procedure is firstly to locate the steel and determine the bar spacing using a covermeter. The cover concrete is removed locally over a suitable bar and an electrical connection made to the steel. It is necessary to check that the steel is electrically continuous by measuring the resistance between two widely separated points. The reinforcing bar is then connected to the half-cell via a digital voltmeter. For details please refer to
- Electrical resistivity tomography – survey planning can be found for example in manufacturer manual - .
- Infrared Spectroscopy - One common problem will be the appearance of two strong bands around 2300-2400 cm-1 (usually out-of-phase). These are CO stretches caused by the ionization of air in the machine. This can be eliminated by purging the instrument with nitrogen gas for 2-3 hours, but the people in charge must know about the problem to fix it.
Sensibility of measurements to environmental conditions
Preparation
Procedures for calibration, initialisation, and post-installation verification
- Electrical resistivity tomography – calibration is performed digitally by microprocessor which is basing on the correction factors stored in memory; correction factors are determined during periodical calibration performed by authorized service centres of manufacturer of the instrument.
Procedures for estimating the component of measurement uncertainty resulting from calibration of the data acquisition system (calibration uncertainty)
Requirements for data acquisition depending on measured physical quantity (e.g. based on the variation rate)
Performance
Requirements and recommendations for maintenance during operation (in case of continuous maintenance)
Criteria for the successive surveying campaigns for updating the sensors. The campaigns include: (i) Georeferenced frame, i.e. the global location on the bridge; (ii) Alignment of sensor data, relative alignment of the data collected in a surveying; (iii) Multi-temporal registration to previous campaigns; and (iv) Diagnostics.
Reporting
- pH indicators - the report should include description of the samples, sampling depth/area, pH values and photo documentation of the pH profile changes, date of measurements, indication of the substances used as pH indicators.
- Uranyl-Acetate Treatment - the report should include description of the samples, sampling depth/area, photo documentation of the observations, date of measurements, indication of the substance used.
- Half-cell potentials method
- Electrical resistivity tomography
- Infrared Spectroscopy
For these methods, reports are usually given automatically by the software used.
Lifespan of the technology (if applied for continuous monitoring)
pH tests are not used in the continuous monitoring. The measurements can be repeatedly performed over time to monitor the progress of carbonation process, but it requires the procedure to be repeated with samples from the same areas. The same applies for other methods.
Interpretation and validation of results
Expected output (Format, e.g. numbers in a .txt file)
- pH indicators – visual observation - graphical representation of pH changes on the surface of a sample;
- Uranyl-Acetate Treatment - the presence of gel visible in UV light as a yellow/ green fluorescent glow;
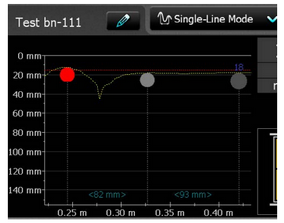
- Half-cell potentials method – potential values as a number; display of a spacing between rebars and change of cover depth:
- Electrical resistivity tomography – map of the conductivity reconstruction, for example:
- Infrared Spectroscopy - plot of absorbance vs wavenumber cm-1;
Interpretation (e.g. each number of the file symbolizes the acceleration of a degree of freedom in the bridge)
- pH indicators – visual observation - comparing the colours on the samples with the scale, which is enclosed to the used indicator, it is possible to determine approximate pH level. For the phenolphthalein test, the red color should be considered the boundary of the concrete carbonization zone, which corresponds to a pH value of 8.5. If phenolphthalein becomes colorless, the concrete is carbonated.
In the case of Rainbow Test, concrete with a navy blue or purple color, which corresponds to a pH value of 11-13, should be considered completely safe for the reinforcement. The transition of the color palette from violet to green should be considered the boundary of the carbonized zone, which corresponds to pH value 9-10. The change of the color palette from green to yellow and possibly orange indicates an advanced corrosion process. If carbonation depth is above 25 mm that can be associated with corrosion which requires monitoring.
- Uranyl-Acetate Treatment - presence of the gel in the sample may indicate progressing alkali-aggregate reaction in the concrete structure.
- Half-cell potentials method – relationship between the measured values of potential and the corrosion probability is described in the standard ASTM C876:
- value below - 350 is associated with more than 90% probability of the steel corrosion,
- value between -350 and +200 is associated with uncertain corrosion activity, which should be confirmed with other methods,
- value higher than – 200 is associated with low probability of steel corrosion activity.
- Electrical resistivity tomography - from the tomographic output it is possible to determine the orientation of the crack, size of the crack as well as contrast between steel and concrete inside the sample, however for correct interpretation it is necessary to apply mathematical model, for example: complete electron model, basing on Maxwell’s equations. Size of cracks can be evaluated visually from photographs.
- Infrared Spectroscopy - absorption characteristics provide information about the molecular structure of the sample.
Validation
Specific methods used for validation of results depending on the technique
- pH indicators - porosity test of concrete can be additionally performed as well as compressive strength tests, since for concrete with a lower compression strength the process of carbonation is progressing faster;
- Uranyl-Acetate Treatment - other non-destructive or destructive techniques can be used for validation of the result;
- Half-cell potentials method - other non-destructive or destructive techniques can be used for validation of the result or theoretical models;
- Electrical resistivity tomography – measurements are validated by numerical methods such as finite difference or finite-element method;
- Infrared Spectroscopy – validation can be performed with other destructive or non-destructive techniques and with other spectroscopic methods such as NMR, UV/VIS.
Quantification of the error
- pH indicators - not applicable.
- Uranyl-Acetate Treatment – not applicable.
- Half-cell potentials method – in modern equipment calculated automatically.
- Electrical resistivity tomography – noise errors are calculated automatically and displayed as a percentage of reading.
- Infrared Spectroscopy – usually calculated automatically in the software of spectrometer.
Quantitative or qualitative evaluation
Detection accuracy
- pH indicators - depth of the carbonated surface should can be measured with an accuracy of 1 mm; depth of the carbonation front can be determined with an accuracy of ±10% to ±15 %.
- Uranyl-Acetate Treatment – depends on the operator.
- Half-cell potentials method - survey results a probabilistic assessment of the risk of corrosion of rebars correlated with potential measured at the concrete surface, detection accuracy can be very
- Electrical resistivity tomography - total accuracy is calculated and displayed automatically in the software.
- Infrared Spectroscopy – depends on the experience of the operator in interpretation of the resulting spectra.
Advantages
- pH indicators:
- easy feasible,
- no specific training required,
- measurements can be performed in laboratory or on the construction site,
- easy to repeat.
- Uranyl-Acetate Treatment:
- high contrast between damaged and not damaged areas,
- easy to repeat.
- Half-cell potentials method:
- widely known technology,
- not expensive equipment.
- Electrical resistivity tomography:
- enables creation of internal maps of the structure.
- Infrared Spectroscopy:
- accurate and precise,
- enables identification of the structure of unknown sample if complied with other spectroscopic techniques.
- small amount of sampling material needed.
Disadvantages
- pH indicators:
- limited measurement precision.
- Uranyl-Acetate Treatment:
- requires the use of a UV light source to fluoresce the gel
- in field analysis where bright sunlight may be difficult to adjust viewing of the concrete under UV light
- uranyl ion is nonspecific, will associate with other cations in concrete leading to false positives
- concrete exposed to uranyl acetate is contaminated and must be disposed with specific procedures.
- Half-cell potentials method:
- not enough accurate
- difficult to repeat.
- Electrical resistivity tomography:
- requires knowledge on the computational and numerical methods.
- Infrared Spectroscopy:
- requires very good expierience in interpretation of the IR-spectra
- requires training on the use of IR-spectrometer
- not easy to perform
- requires expensive equipment
Possibility of automatizing the measurements
The indicators methods are simplified, used in in-situ tests, consist only of spraying on fresh concrete breakthrough the appropriate indicator and reading the pH value from the available range. No consideration on automatisation are taking place, since this methods are only used as a, on-site, simple method of estimation of pH and there is no need of that. However some more accurate methods can displace the following approach in the future.
Barriers
- pH indicators - in case of phenolphthalein and thymolphthalein test, these are sensitive only to the selected pH. It is not possible to assess the distribution of the carbonated surface on tested cross-section using this two tests.
- Infrared Spectroscopy – althought it is used in different areas also as quantitative method - for concrete inspection purposes should not be considered so. The intensity of certain IR bands can vary as a function of their content in the sample, it is difficult to make the relation between the intensity or the area of an IR band and a specific concentration. Traces of chemical compounds can be under-estimated or erased due to the high intensity of certain signals, for instance of silica or calcium carbonate. The presence of a large amount of capillary water into the hydrated sample can mask some of the chemical compounds.
Existing standards
- ASTM F710-11 Standard Practice for Preparing Concrete Floors to Receive Resilient Flooring – indicating method of surface pH measurement
- EN 14630:2006 Products and systems for the protection and repair of concrete structures - Test methods - Determination of carbonation depth in hardened concrete by the phenolphthalein method
- EN 1239-12:2020 Testing hardened concrete - Part 12: Determination of the carbonation resistance of concrete - Accelerated carbonation method
- ASTM C876 Standard Test Method for Corrosion Potentials of Uncoated Reinforcing Steel in Concrete
- ASTM C876-91 (2001). “Standard test method for half-cell potentials of uncoated reinforcing steel in concrete.” ASTM Standards Developed by Subcommittee, Vol. 03.02, G.1.14, pp. 42.
Applicability
Relevant knowledge fields
1.11.1 Civil engineering:
- technical inspections of the concrete structures
- facility renovations
- foundations maintenance
- historical buildings presevations
- evolution of moisture distributions in concrete structures.
1.11.2 Medicine and pharmacology:
- identification of substances
- determination of progress of reactions
- impurities detection.
1.11.3 Material engineering:
- degree of polymerization
- characterization of micro- or nanostructured materials.
1.11.4 Food industry:
- concentration of compounds in food products
1.11.5 Geophysics:
- measurement of electrical resistance of soil
- monitoring of water movement.
Performance Indicators
- loss of section
- cracks
- obstruction/impeding
- displacement
- debonding
- delamination
- spalling
- reinforcement bar corrosion.
Type of structure
- concrete bridges
- tunnels
- masonry bridges.
Spatial scales addressed (whole structure vs specific asset elements)
Inspection directed on elements of the structure near to the reinforcement for assessment of the corrosion risk. Half-cell potential method is useful in inspection of bridge decks, concrete piers and docks, foundations and tunnel lining.
Materials
- aggregate
- concrete
- technical ceramic
- building lime
- slag
- cement
- gravel
- pigment
- ferroalloys.
Available knowledge
Reference projects
No reference projects.
Other
Manufacturers websites:
NDT James Instruments – Basic Half Cell Potential System for Locating Areas of Rebar Corrosion
Hammond Concrete Services – Elcometer 331
Hammond Concrete Services – Elcometer – covermeter manual
Hammond Concrete Services - Profometer Corrosion Half-Cell
Hammond Concrete Services – Profometer Corrosion Half Cell manual
Bibliography
- A. Nadezhdin, D. A. (1988). The Effect of Deicing Chemicals on Reinforced Concrete. Transportation Research Record, pp. 31-37.
- B. Elsener, C. A. (2003). RILEM TC 154-EMC: Half-cell potential measurement -Potential mapping on reinforced concrete structures. Materials and Structures vl. 36, 461-471.
- Buettner, M. R. (1996). Electrical resistance tomography for imaging concrete structures. Structural materials technology an NDT conference, San Diego. San Diego.
- Campbell, D. S. (1991). Detecting Carbonation.
- Czarnecki L., W. P. (2008). Metody oceny przebiegu karbonatyzacji betonu . Materiały II Sympozjum naukowo-techniczne Trwałość Betonu. Górażdze Cement.
- David Whiting, T. M. (1992). History of the Rapid Chloride Permeability Test. Transportation Research Record, pp. 55-62.
- Elcometer 331. Concrete Covermeter. Model SH • Model TH. (2006-2009). Copyright Elcometer Limited.
- ERTLab Studio . (n.d.). The DAS-1 . USA .
- Geostudi Astier srl and Multi-Phase Technologies LLC. (2006). 3D ELECTRICAL RESISTIVITY TOMOGRAPHY - INVERSION SOFTWARE_The ERTLab . User Manual . Retrieved from https://www.mptech3d.com/_files/ugd/bee905_dc4757cf25824c4e8afdea7cfb5f5d90.pdf
- Ghosh, S. &. (1974). Absorption and reflection infrared spectra of major cement minerals, clinker, and cements. . Journal of Materials Science, vol. 9 , pp. 1577-1584.
- Grzegorz Bajorek, B. K.-H. (2014). Instrumentalne metody analiz chemicznych materiałów budowlanych w ujęciu normowym. Scientific Works of Institute of Ceramics and Building Materials, pp. 6-14.
- Hammond Concrete Services . (n.d.). PM600-630 Profometer Manual . Switzerland.
- Hemeda, S. (2013). Electrical Resistance Tomography (ERT) Subsurface Imaging for Non- destructive Testing and Survey in Historical Buildings Preservation. Australian Journal of Basic and Applied Sciences, pp. 344-357.
- Hughes, T. M. (1995). Determining cement composition by Fourier Transform Infrared Spectroscopy. . Advanced Cement Based Materials, 2, pp. 91-104.
- Izabela Wysocka, A. Z.-J. (2019). Korozja betonu. Badanie przebiegu korozji kwasowej beotnu cementowego i jego skażenie chlorkami. Technologie Materiałów Budowlanych (pp. 1-5). Gdańsk: Politechnika Gdańska.
- J. Hulimka, M. K. (2020, January 3). Basic Chemical Tests of Concrete during Assessment of Structure Suitability - Discussion on Selected Industrial Structures . Applied Science 12, 358.
- Jacek Hulimka, M. K. (2020, January 3). Basic Chemical Tests of Concrete during the Assessment of Structure Suitability—Discussion on Selected Industrial Structures. Applied sciences, pp. 1-16.
- Jaroszyńska-Wolińska, J. (2011). Chemia w laboratorium budownictwa. Lublin: Politechnika Lubelska.
- Jóźwiak, H. (2009). Możliwości wykorzystania metody jądrowego rezonansu magnetycznego w badaniach domieszek chemicznych w betonie. Prace Instytutu Techniki Budowlanej , pp. 3-13.
- Juan Lizarazo-Marriagaa, P. C. (2009, October 15). Determination of the concrete chloride diffusion coefficient based on an electrochemical test and an optimization model. Materials Chemistry and Physics, pp. 536-543.
- Karhunen, K. (2013). Electrical Resistance. Kuopio: University of Eastern Finland.
- Karhunen, K. S. (2010). Electrical resistance tomography imaging of concrete. . Cement and Concrete Research 40 , pp. 137-145.
- KImmo Karhunen, A. S. (2010, 09). Electrical resistance tomography for assessment of cracks in concrete. Aci Materials Journal, pp. 523-531.
- Lataste, J. S. (2003). Electrical resistivity measurement applied to cracking assessment on reinforced concrete structures in civil engineering. NDT & E international, 36(6), pp. 383-394.
- Nadejda V. Orlova, J. C. (1999). The Study of Chloride Ion Migration in Reinforced Concrete Under Cathodic Protection. Oregon: Oregon Department of Transportation.
- P. von der Hardt, H. R. (1981). Neutron Radiography Handbook. Nuclear Science annd Technology. London: D. Reidel Publishing Company.
- Pasierb, B. (2015). Nmerical Evaluation of 2D Electrical Resistivity Tomography for subsoil Investigations. Enviromental Engineering, pp. 101-112.
- Perkin Elmer . (2011-2015). Spectrum 10 Spectroscopy Software Product Brochure.
- Philip J. Nixon, J. L. (2008). The EU “Partner” Project - European Standards Tests to Prevent Alkali Reactions in Aggregates Final Results and Recommendations. Trondheim: 13th International Conference on Alkali-Aggregate Reaction in Concrete (ICAAR).
- Piotr Gwoździewicz, D. D. (2010). Wpływ dyfuzji jonów chlorkowych i procesu karbonatyzacji na trwałość żelbetowych obiektów mostowych. Czasopismo Techniczne. Budownictwo, pp. 11-23.
- Proceq SA. (2016). Profometer. Operating Instructions. Proceq SA.
- Reis, R. &. (2019). Using Thymolphthalein for Accelerated Carbonation Testing of High Volume Fly Ash Cementitious Blends. Selected Papers of the 8th International RILEM PhD Workshop held in Marne-la-Vallée.
- Smith, D. (2006). The Development of a Rapid Test for Determining the Transport Properties of Concrete. New Brunswick: University of New Brunswick.
- The Concrete Society. (2000, 08). Current Practice Sheet 120 - Half-cell potential surveys. CONCRETE.
