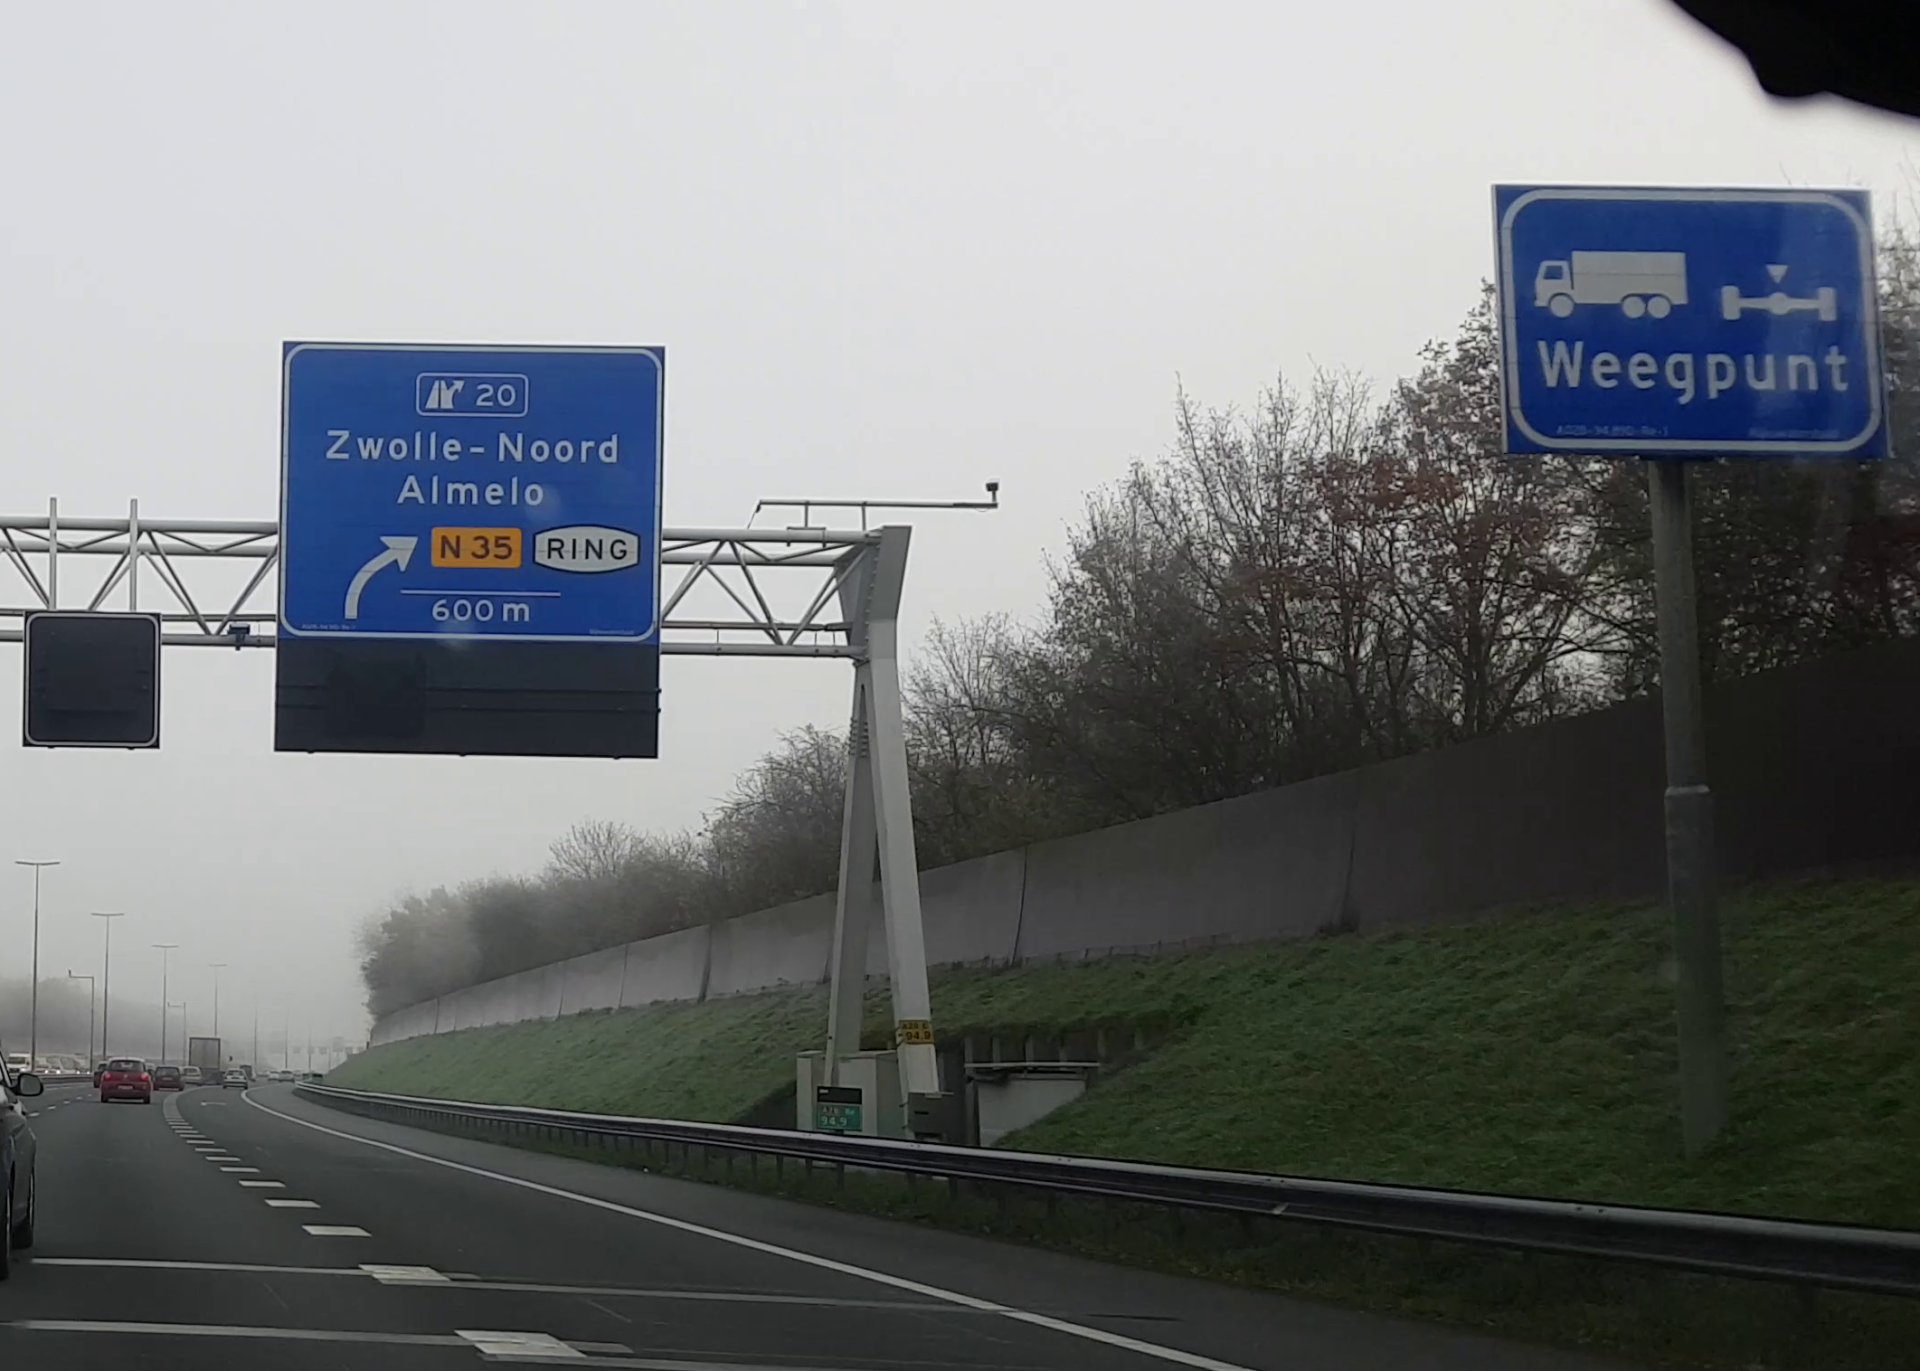
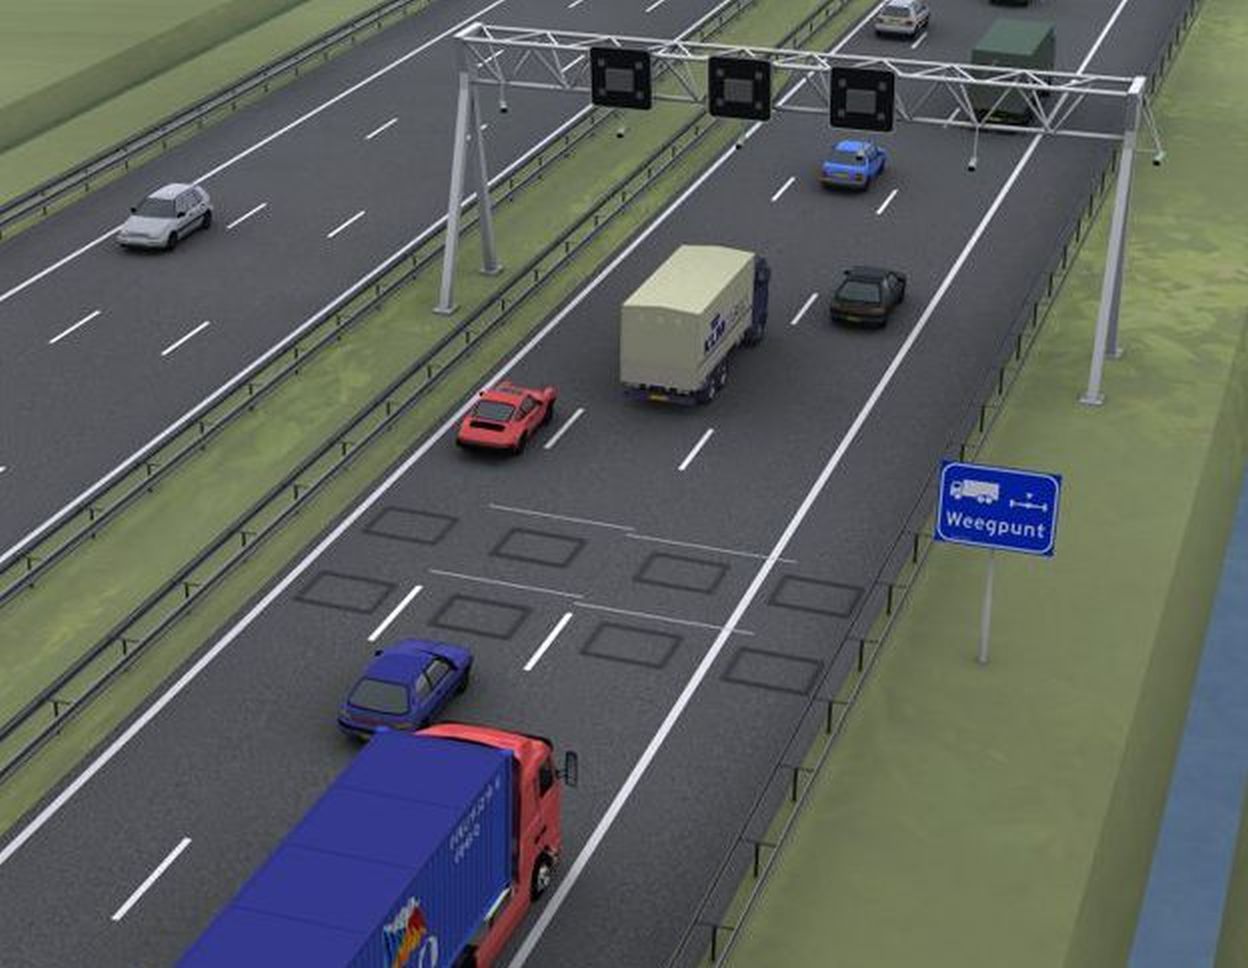
Weigh in Motion systems are measuring devices for measuring traffic loads (axel loads, axle distances, vehicle loads, passage date and time). See
https://en.wikipedia.org/wiki/Weigh_in_motion
Object description
Weigh in Motion systems are measuring devices for measuring traffic loads (axel loads, axle distances, vehicle loads, passage date and time). See https://en.wikipedia.org/wiki/Weigh_in_motion
Civil engineering type
:
Year of construction
:
1998
Composed of materials
:
Location coordinates
:
51° 45' 28.91" N, 4° 38' 39.70" E
Country
:
Loading map...
{"minzoom":false,"maxzoom":false,"mappingservice":"leaflet","width":"auto","height":"350px","centre":false,"title":"","label":"","icon":"","lines":[],"polygons":[],"circles":[],"rectangles":[],"copycoords":false,"static":false,"zoom":false,"defzoom":6,"layers":["OpenStreetMap"],"image layers":[],"overlays":[],"resizable":false,"fullscreen":false,"scrollwheelzoom":true,"cluster":false,"clustermaxzoom":20,"clusterzoomonclick":true,"clustermaxradius":80,"clusterspiderfy":true,"geojson":"","clicktarget":"","imageLayers":[],"locations":[{"text":"\u003Cb\u003E\u003Cdiv class=\"mw-parser-output\"\u003E\u003Cp\u003EWeigh in Motion (system near Moerdijk bridge)\n\u003C/p\u003E\u003C/div\u003E\u003C/b\u003E\u003Cdiv class=\"mw-parser-output\"\u003E\u003Cp\u003EWeigh in Motion systems are measuring devices for measuring traffic loads (axel loads, axle distances, vehicle loads, passage date and time). See \u003Ca rel=\"nofollow\" class=\"external free\" href=\"https://en.wikipedia.org/wiki/Weigh_in_motion\"\u003Ehttps://en.wikipedia.org/wiki/Weigh_in_motion\u003C/a\u003E\n\u003C/p\u003E\u003C/div\u003E","title":"Weigh in Motion (system near Moerdijk bridge)\n","link":"","lat":51.75803055555556,"lon":4.644361111111111,"icon":"/images/imsafe/c/c8/Blue-marker.png"}],"imageoverlays":null}
Object analysis
The data is used for several reasons, varying from actual bridge specific load conditions to determining design loads for EN 1991-2. Moreover the data may be served for determining the expected damage (rainflow analyses taking into account the SN curve) of for probabilistic analyses for determining the design load regarding static load conditions for specific bridge details
Object state
The state of the structure is not appropriate. The data may serve as input for any structure
Observed deterioration processes
:
Observed damage types
:
Performance indicators
:
Images
Documents
This case study was contributed by Adri Vervuurt of TNO. Last edited by technical staff.

